The Aussie dollar has been under the extreme level of bearish pressure in the global market from the very beginning of the year 2016 and things went to the extreme level after the U.S dollar index secured a 14-year record high in the global market. Most of the leading investors were in doubt regarding the next bearish target of the AUDUSD pair but things settled down nicely after the green bucks lost its bullish momentum in the global market after the U.S consumer sentiment turned extremely negative in the global market.
Let’s do the weekly chart analysis in the AUDUSD pair
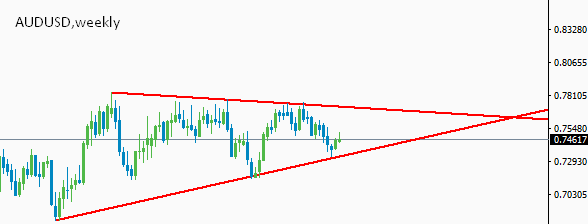
Figure: Price trading in triangular range in weekly chart
From the above figure, you can see that the price of the AUDUSD pair has been trading in a triangular region in the trading platform. The professional Aussie traders made a decent income by selling the triangle resistance level in the higher time frame. The trade setups were extremely good as it was executed in favor of the long-term existing trend with price action confirmation signal. But over the period of time trading the triangle support and resistance level is getting much risk as the price is verging near the breakout region of the triangle chart pattern. Though the long-term trend in the AUSUSD pair is bearish we can see a nice bullish morning start formation in the triangle support region in the trading platform. This gives us a clear clue that the price is not ready to break the critical support level at 0.7320 in the global market rather it might surge upward in the upcoming days. However, a clear break of the tail of the bullish morning start pattern will initiate a sharp fall in the AUDUSD pair in near term future. The bullish target still remains intact on the weekly chart and the aggressive long traders are aiming for the triangle resistance level as their profit-taking zone.
Let’s do the daily chart analysis in the AUDUSD pair
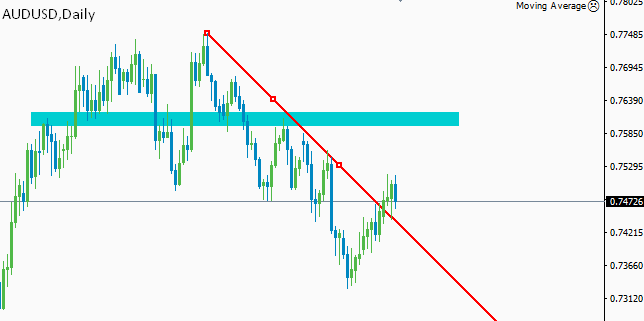
Figure: Broken trend line suggest further bullish movement
In the above figure, you can clearly see that the price has broken the bearish trend line resistance on the daily chart and this clearly suggest that the pair has scope to move upwards in the upcoming days. However, the bullish movement of the pair is still capped unless the price break the critical resistance level at 0.7514 level in the global market. A clear break of the price above that level will bring a significant amount of buying pressure in the AUDUSD pair which will ultimately drive the price to up towards the shaded region at 0.7595 in the global market. The professional traders will pay great attention to this level as they initiate their short order with bearish price action confirmation signal at the trading platform.
Fundamental analysis: The Aussie is most likely to go upward when we consider the fundamental factors in the global market. The recent performance of the U.S economy is significantly week in the global market and all the investors are now eyeing on the upcoming FED meeting. If the FED hike their interest rate then we will see a bearish movement in the AUDUSD pair in favor of the long-term prevailing trend in the market. On the contrary, a dovish statement from Chairperson will fuel of the Aussie buyers and drive the price up in the market.
Summary: Considering the technical factors the AUDUSD pair remains strongly bullish in the global market but things will get much clear after the FED interest rate hike decision in the FOMC meeting minute. Most of the leading investors are currently waiting on the sideline and waiting for a clear clue to trade the pair with price action confirmation signal. However, when you execute any orders make sure that you use the proper risk management factors to reduce the risk exposure in trading.